If you have not looked up your USDA plant hardiness zone in a few years, there is a good chance it has changed. When the U.S. Department of Agriculture released its updated Plant Hardiness Zone Map, about half the country moved into the next warmer half-zone. Nashville went from 7a to 7b. Memphis went from 7b to 8a. For anyone ordering trees this winter for spring planting, that matters: the zone on the tag is the first filter for whether a tree will survive your coldest night.
We pulled the official numbers from USDA's Agricultural Research Service, a 243-city analysis from Climate Central, and Tennessee examples from local reporting and UT Extension, then matched them against the published hardiness ranges for 10 native trees, shrubs and vines. Every figure is cited at the end. The infographic is free to republish with credit; the embed code is at the bottom.
Infographic: Did Your Planting Zone Change? The USDA Hardiness Map by the Numbers
- ~50% of the U.S. moved one half-zone warmer on the 2023 USDA map; the rest stayed in the same half-zone (USDA ARS)
- 13,412 weather stations behind the 2023 map, up from 7,983 in 2012 (USDA ARS)
- 1991–2020: the 30-year window of average coldest winter temperatures the zones are built on (USDA ARS)
- 80 million gardeners and growers are the map's most frequent users (USDA ARS)
- 67% of 243 U.S. locations moved into a warmer zone between 1951–1980 and 1995–2024 (Climate Central)
- +3.7°F: average warming of the coldest annual temperatures across 235 locations (Climate Central)
- Nashville 7a → 7b; Memphis 7b → 8a (WPLN; UT Extension Shelby County)
What a hardiness zone actually measures
A hardiness zone is built from one number: the average annual extreme minimum temperature at a location, averaged over 30 years. USDA divides the country into 10°F zones, and each zone into two 5°F half-zones, “a” (colder) and “b” (warmer). There are 13 zones across the U.S. and its territories. As climatologist John Abatzoglou of the University of California, Merced put it to WPLN, “A plant hardiness zone is really just defined by the coldest night of the year.”
That is why a plant tag reading “zones 4–8” is really a statement about cold tolerance at the bottom end and, more loosely, about heat and humidity tolerance at the top end.
What changed on the 2023 USDA map
USDA's Agricultural Research Service and Oregon State University's PRISM Climate Group released the current map on November 15, 2023, the first update since 2012. The key changes, per ARS:
- More data. The map uses 13,412 weather stations, compared with 7,983 for the 2012 map, and covers 1991 to 2020.
- A warmer picture for half the country. About half of the U.S. shifted to the next warmer half-zone. The other half stayed in the same half-zone. Those shifts represent warming of 0 to 5°F.
- Sharper detail in Alaska, where resolution improved from 6¼ square miles to ¼ square mile.
- Wide use. About 80 million American gardeners and growers use the map, and USDA's Risk Management Agency uses it for certain crop insurance standards.
One caveat from the map's developers is worth repeating: ARS cautions against treating the zone changes in some areas as reliable evidence of global climate change, because part of the shift comes from better data and mapping methods, not only from warmer winters.
The longer trend: 243 U.S. cities
Climate Central, a nonprofit climate research group, compared the coldest annual temperatures in 1951–1980 with 1995–2024 using NOAA station data. Its 2025 analysis found:
- Hardiness zones increased in 67% (164) of 243 locations.
- The coldest annual temperatures in 235 locations were on average 3.7°F warmer in 1995–2024 than in 1951–1980.
- Under a middle-of-the-road emissions scenario (SSP2-4.5), 90% of locations are projected to shift zones by mid-century (2036–2065).
Climate Central notes that its station-based zones can differ by up to one half-zone from USDA's gridded 2023 map, so use the official USDA map to look up your own address.
Tennessee: Nashville and Memphis moved up
Tennessee's two largest metros both shifted on the new map:
| City | 2012 map | 2023 map | Source |
|---|---|---|---|
| Nashville | 7a | 7b | WPLN News, Nov. 20, 2023 |
| Memphis | 7b (5 to 10°F) | 8a (10 to 15°F) | UT Extension Shelby County, Jan. 3, 2024 |
Climate Central's 2023 analysis singled out Nashville: its average annual minimum temperature rose from -0.3°F in 1951–1980 to 9.2°F in 1993–2022, a 9.5°F jump that moved it from zone 6 to zone 7 on that station-based measure. Dr. Chris Cooper of UT Extension Shelby County, writing for the Memphis Area Master Gardeners, reminds growers that “the map alone will not guarantee success.”
Our own farm sits in Tennessee, and we have been growing trees here since Roscoe Tate founded TN Nursery in 1959. Today we grow on 170 acres, and we have watched the same species thrive across a wide band of zones.
Which native trees fit your zone
Here are the published hardiness ranges for 10 of the native trees, shrubs and vines our customers ask about most. Zones are from the NC State Extension Gardener Plant Toolbox, except eastern redbud, which is from UF/IFAS Extension.
| Plant | USDA zones | What it means for warming zones |
|---|---|---|
| Red maple (Acer rubrum) | 2a–9b | One of the widest ranges of any native shade tree |
| White oak (Quercus alba) | 3a–9b | Comfortable across every Tennessee zone, old or new |
| American elm (Ulmus americana) | 3a–9b | Wide range; choose disease-resistant selections |
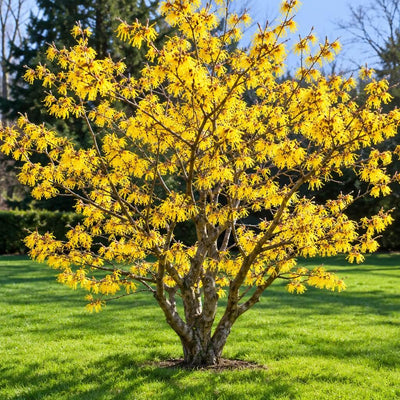
| Witch hazel (Hamamelis virginiana) | 3a–9b | Fall-blooming understory shrub for zones 3–9 |
| Sugar maple (Acer saccharum) | 3a–8b | Zone 8a Memphis is near its warm edge; NC State notes heat and drought sensitivity |
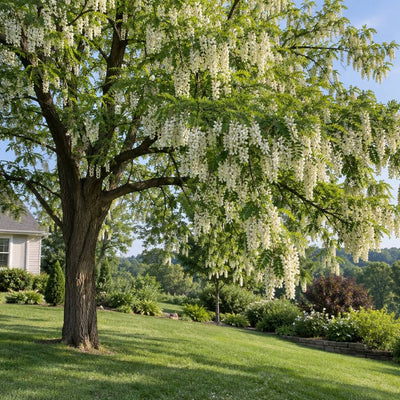
| Black locust (Robinia pseudoacacia) | 3a–8b | Tough nitrogen-fixer for large rural sites |
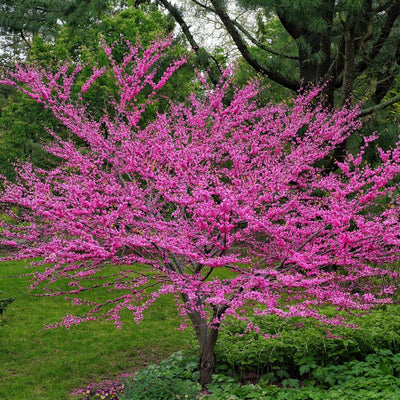
| Eastern redbud (Cercis canadensis) | 4b–9a | Fits every Tennessee zone |
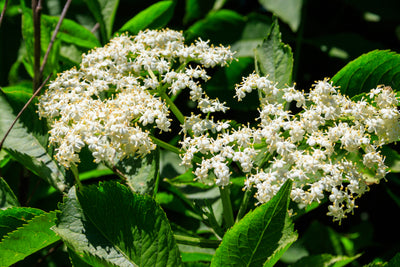
| American elderberry (Sambucus canadensis) | 4a–8b | Still in range at 8a; give it moist soil |
| Trumpet vine (Campsis radicans) | 4a–10b | The most heat-tolerant plant on this list |
| Pawpaw (Asimina triloba) | 5a–9b | Hardy across the eastern U.S. into zone 9 |
Natives with a wide margin
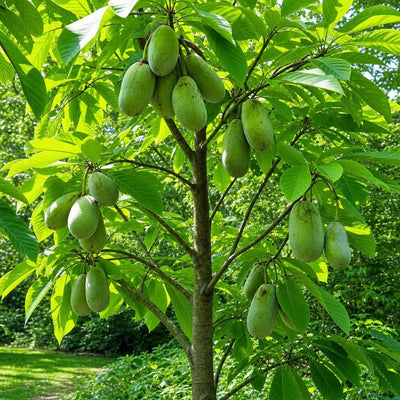
Red maple, white oak, American elm and witch hazel each span seven or more zones, which gives them a buffer on both ends if your zone shifts again. Pawpaw is a good example of a native fruit tree with room to spare: its range runs from 5a to 9b. At TN Nursery we have grown roughly 2 million pawpaw trees from about 2 tons of seed, and our pawpaw growing guide covers planting and care. Eastern redbud, rated 4b–9a, is another safe bet anywhere in Tennessee; we have grown more than 200,000 of them.
Trees to site carefully in the warmest zones
Sugar maple, black locust and American elderberry all top out at zone 8b. They still fit a Memphis yard at 8a, but there is less margin than there used to be. For sugar maple in particular, NC State notes sensitivity to heat, drought, compaction and road salt, so give it good soil and water through dry spells. Our maples have had a moment on screen, too: the U.S. Air Force and the Discovery Channel used TN Nursery maple trees for a time-lapse of a tree going from dormancy to full leaf.
What about crepe myrtles?
Crepe myrtle is not native (it comes from Asia), but it is one of the most-planted flowering trees in the South, and it is the classic example of a plant gardeners watch as zones shift. NC State Extension warns that in zones 5 and 6 it is susceptible to winter injury, especially to its top growth. In Tennessee's zone 7 and 8 areas, a regular pink crepe myrtle is a dependable summer bloomer.
How to use the new map when you plant this winter
- Look up your ZIP code on the USDA interactive map at planthardiness.ars.usda.gov, and read the notes below the map.
- Check both ends of the range. A tree rated 3–8 is fine for cold, but if you are now in 8a, you are near its warm limit.
- Remember what zones leave out. Zones measure only winter cold. Summer heat, humidity, soil, drainage and rainfall all decide whether a tree thrives.
- Ask local experts. USDA recommends checking with local nurseries, extension offices and master gardeners.
- Plant during dormancy. Bare-root and dormant trees planted in late fall and winter can grow roots before spring leaf-out. Browse our native trees and shade trees collections, and see our tree planting myths guide before you dig.
Use this infographic
Journalists, educators and bloggers are welcome to republish this data and infographic with credit and a link. Copy this code:
<p><a href='https://tnnursery.net/blogs/garden-blog/usda-hardiness-zone-changes'>Did Your Planting Zone Change? The USDA Hardiness Map by the Numbers</a> (infographic and data by <a href='https://tnnursery.net/'>TN Nursery</a>)</p>Want the full-resolution PNG (1200 px wide)? Email us and we will send it.
Sources
- USDA Agricultural Research Service, “USDA Unveils Updated Plant Hardiness Zone Map” (Nov. 15, 2023).
- Climate Central, “Warming Planting Zones” (Apr. 30, 2025).
- Climate Central, “Shifting Planting Zones” (Apr. 5, 2023).
- Caroline Eggers, WPLN News, “Nashville has a new plant hardiness zone” (Nov. 20, 2023).
- Dr. Chris Cooper, UT Extension Shelby County, “The Updated Plant Hardiness Zone Map,” Memphis Area Master Gardeners (Jan. 3, 2024).
- NC State Extension Gardener Plant Toolbox: Asimina triloba, Quercus alba, Acer rubrum, Acer saccharum, Ulmus americana, Hamamelis virginiana, Sambucus canadensis, Robinia pseudoacacia, Campsis radicans, Lagerstroemia indica.
- Gilman, Watson et al., UF/IFAS Extension ENH304, “Cercis canadensis: Eastern Redbud” (rev. Dec. 2018).